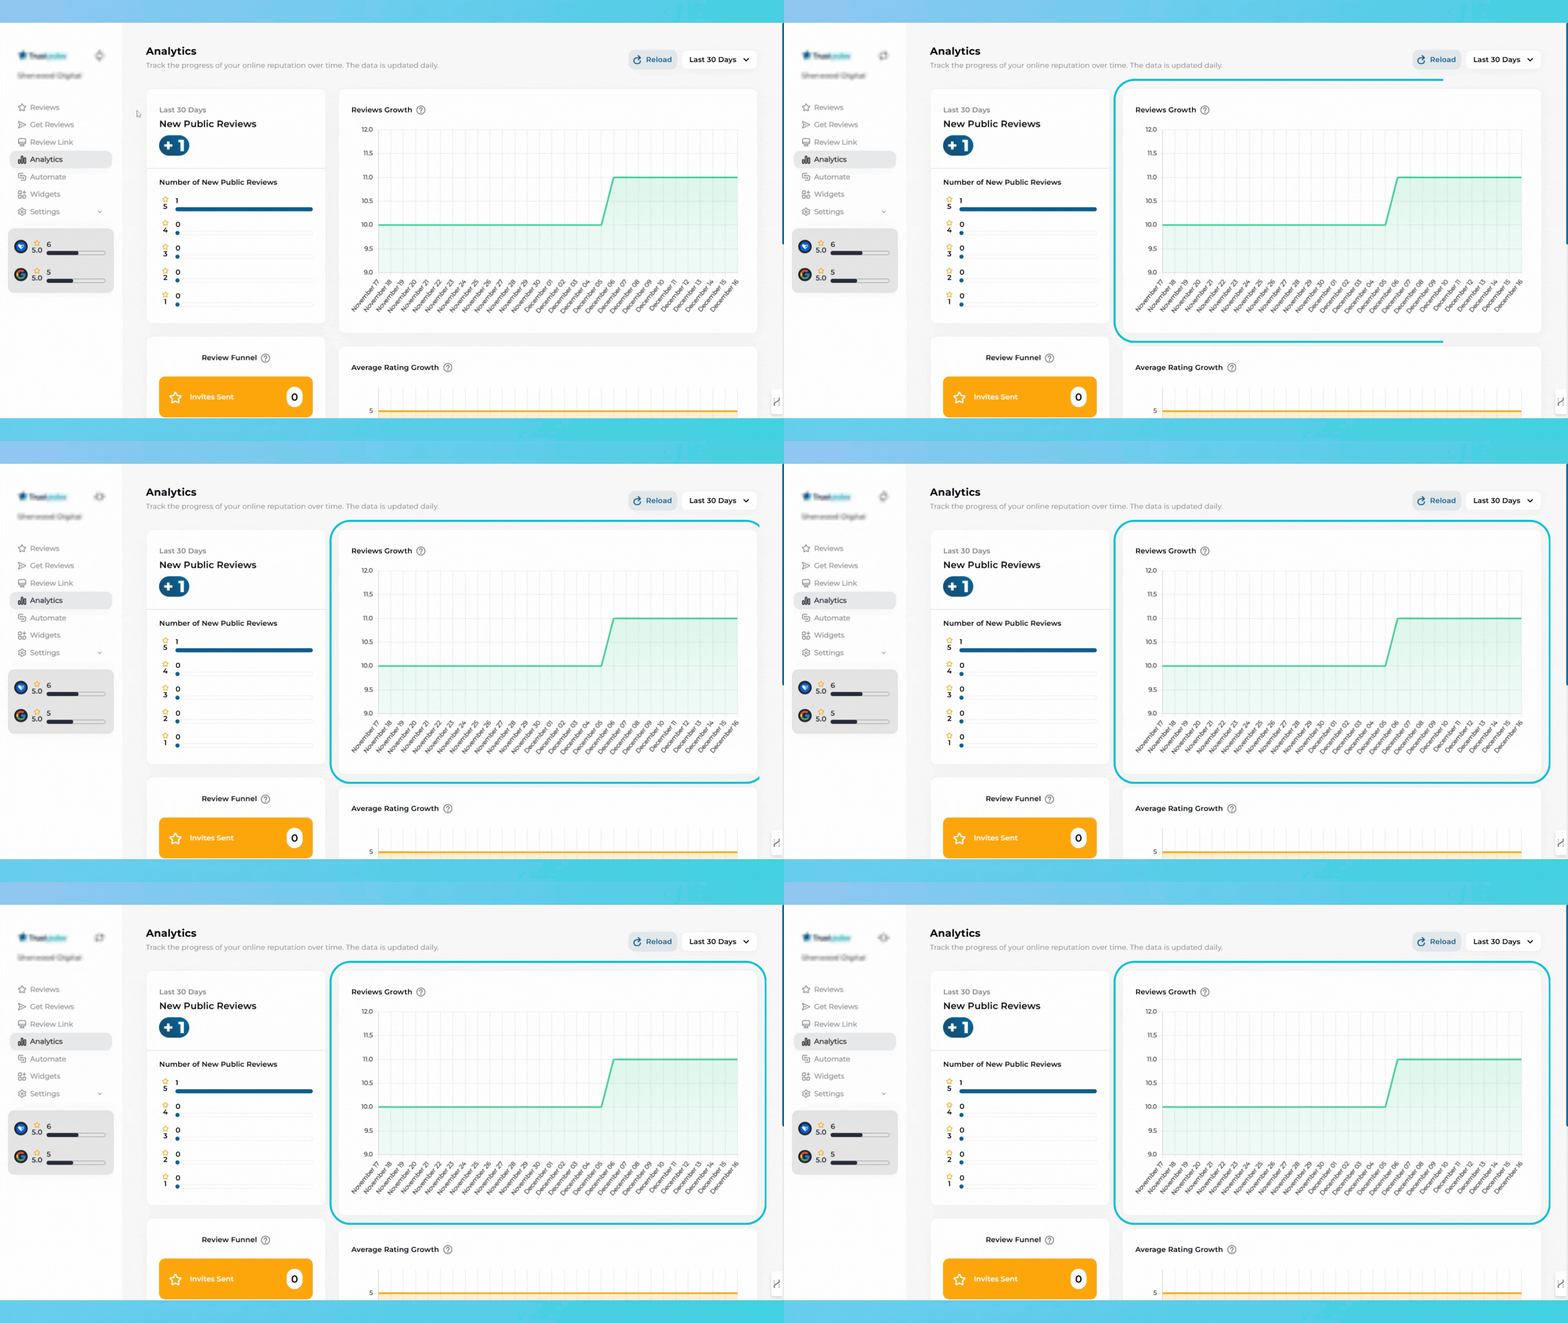
The charts in your analytics section tell your business's story. Here's how to read them:
1. Finding the Growth Chart:
- Look for "Reviews Growth" chart
- Notice the line showing review count over time
- Spot any trends or patterns

2. Understanding the Trends:
- Upward slope = Healthy growth
- Flat line = Need more review collection efforts
- Downward slope = Requires immediate attention
Example interpretations:
- Scenario 1: Steady Growth
- Starting point: 50 reviews
- After 3 months: 85 reviews
What it means: Your review collection strategy is working
- Scenario 2: Plateau
- Starting point: 120 reviews
- After 3 months: 127 reviews
What it means: Time to boost your review requests